How to Customise Your Excel Reports With Slicers
At Happy we talk a lot about how great Pivot Tables are — and Slicers make your Pivot Tables and reports even better. With Slicers, you can have one Pivot Table that switches between different categories through the click of a button.
In this blog, Ian gives step-by-step instructions with how you can create your very first Slicer.
Hi, we are Happy
We are leading a movement to create happy, empowered and productive workplaces.
How can we help you and your people to find joy in at least 80% of your work?
In his blog on Pivot Perfection, Darren showed us how to easily produce a series of Pivot Tables for each category we want to filter on. Slicers make it easy to have one Pivot Table that can switch between different categories.
Let’s start with the same data that Darren used:

Example data
The next step is to add a Slicer:
1. Go to the Options tab of the Pivot Table Tools on the ribbon
2. Click on Insert Slicer
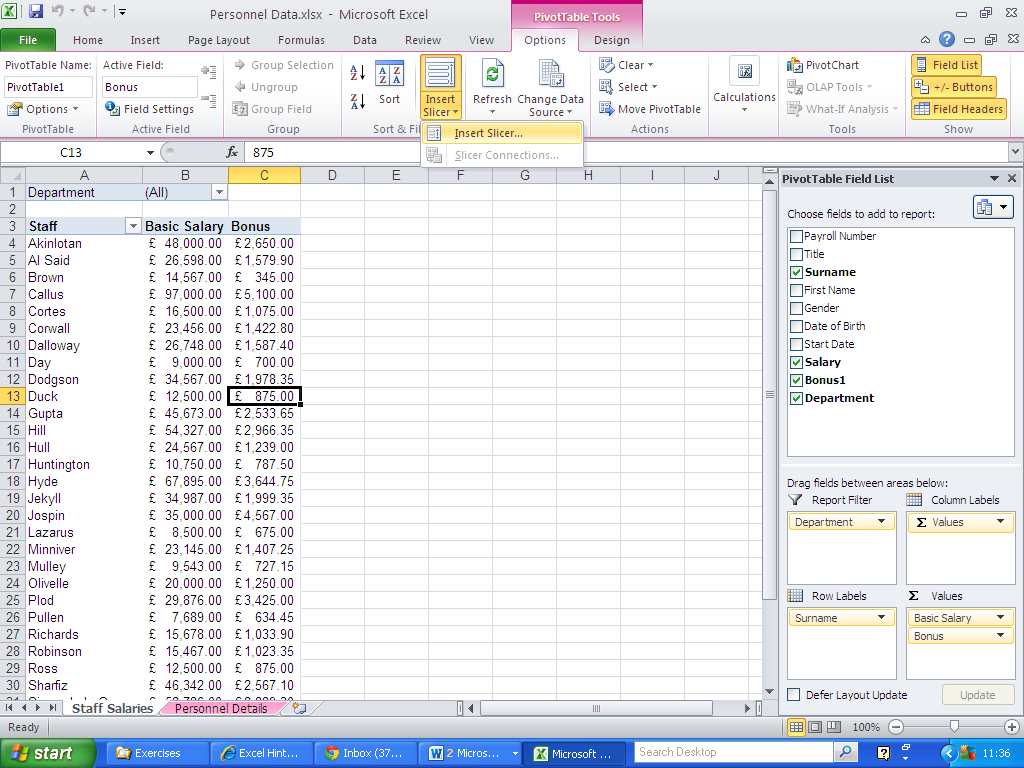
Insert Slicer option
3.Choose the field you want to filter on, in this case Department

4. Click OK
5. A Slicer box will appear on your worksheet:
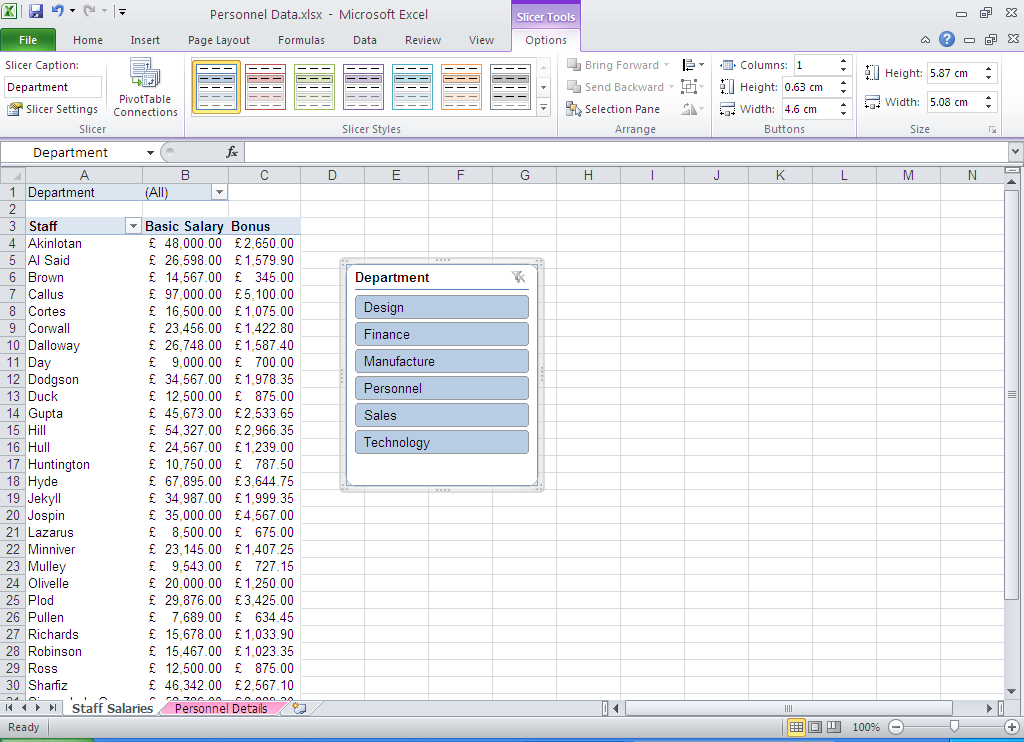
Example of a Slicer box
6. Click on the category you are interested in, for example, the Design department
7. The Pivot Table will update to show the values for that category:

8. To change to a different category, just click on the appropriate value in the slicer box
9. To select multiple values, do a normal click on the first value, then control-click on the other values:

Selecting multiple values
10. To clear the filter, click on the icon in the top-right corner of the Slicer box

Clearing your filter
11. You can move and re-size the Slicer box by clicking and dragging on the border of the box
Related Blogs
- How to Create a Pivot Table - If you've never used Pivot Tables before, start with this two-minute video.
- How to Group Dates Together in a Pivot Table - Learn how to group your data together by date in this short video.
- How to Use Pivot Tables in Excel to Create Sub-Reports - Another useful function of Pivot Tables that could save you time at work.
Why not sign up to our newsletter?
Sign up to our monthly newsletter, full of tips, tricks and news to help you to be happier and more productive at work.

Improve your productivity in Excel with happy
Happy has high-quality, learner-focused Excel training courses for all skill levels, designed to improve your confidence and productivity and our online learning programme is just as interactive as our classroom sessions.
Here are our most popular options:
- If you are new to Excel, take a look at our Introduction to Excel course. Our next public dates are 29th July, held online, and in the classroom at Happy on 25th September.
- If you are comfortable with using Excel and creating formulas, take a look at our Excel for Intermediate Users course. Join us in the classroom on 31st July, or online on 29th July.
- Wanting to analyse Excel data more effectively? We have an intensive full-day Excel for Advanced Users course. Our next online session is on 24th July, or join us in the classroom on 15th July.
- For expert users, we have an Excel for Expert Users course, covering advanced formulas and functions such as XLOOKUP and dynamic array functions. Join us in the classroom on 22nd July, or online on 15th October.
Our learners tell us that they save an average of 32 minutes a day with our Excel training courses. How much time could you save with us?
Why learn online with Happy?
- Interactive and engaging - just like our classroom sessions
- Bitesize or full-day sessions - fit around your schedule
- Learn from home - all you need is a quiet place to call from and an internet connection
- IT Helpline - 2 years of free support after your course
- No quibble money-back guarantee

Ian Balboa
Ian was an IT trainer with Happy from 2007 to 2018, first as a member of staff and then as an associate. He delivered IT training in Microsoft Office (Word, Excel, PowerPoint, Access, Outlook) as well as VBA, SQL, HTML and Photoshop.