Pivot Tables: How to Put Your Filtered Data on Different Excel Sheets
Learn how to get your Pivot Table to put your filtered data on different sheets in Excel.
Hi, we are Happy
We are leading a movement to create happy, empowered and productive workplaces.
How can we help you and your people to find joy in at least 80% of your work?
I think we’ve all declared our love of Pivot Tables haven’t we? If you’re still undecided let us offer you another inducement.
You can learn how to create a basic Pivot Table in just 3 minutes in our previous blog, How to Create a Pivot Table.
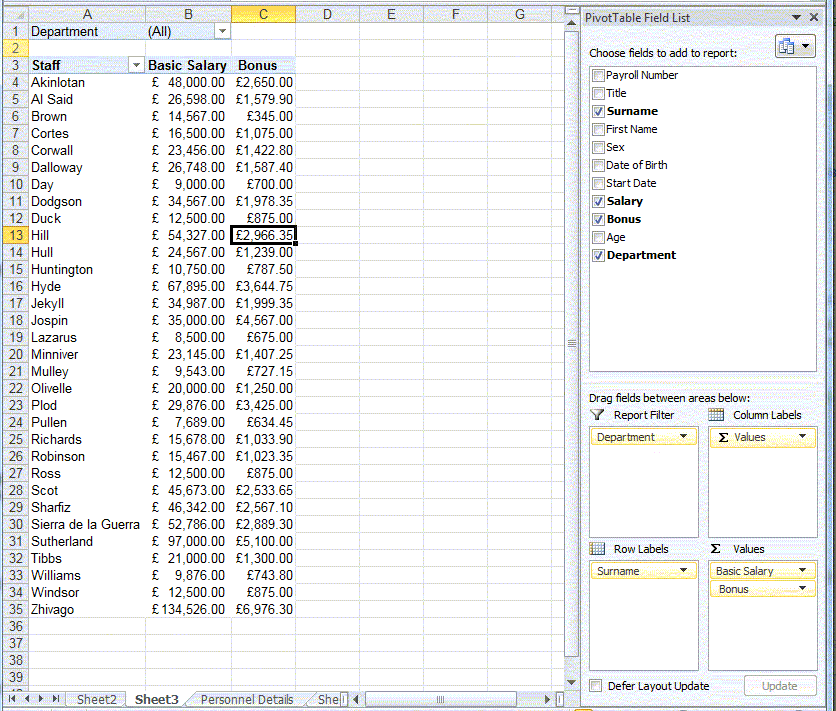
In the screenshot below we’ve created a Pivot Table from our staff database. We’ve created this because we want to be able to see all the staff Salaries and Bonuses by department. We could have put the department field in the row labels area but ideally we’d like each department on a different sheet so that we can send the results to each department head.
So for now we’ve put Department in the Report Filter area of the Pivot Table.
The next step is to get the Pivot Table to place the filtered data onto new sheets, and this is just too easy…
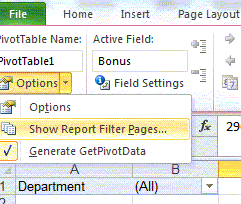
1. Go to the Options tab of the Pivot Table tools tab on the ribbon
2. Click on the options drop down
3. Click Show Report Filter Pages
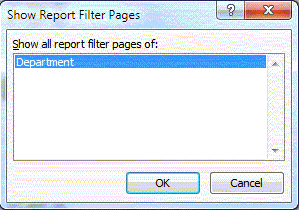
4. If you have more than one field in the Report Filter area of your Pivot Table, make sure you select the correct one!
5. Click OK – and that’s it!
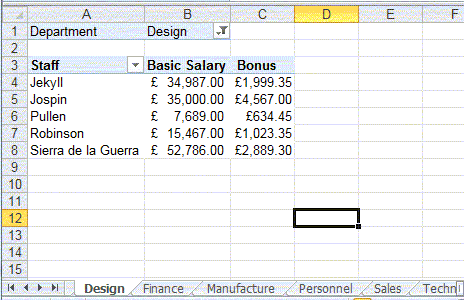
A new sheet has been created for each department, has been named and has got the correct data on!
Related Blogs
- How to Create a Pivot Table - If you've never used Pivot Tables before, start with this two-minute video.
- How to Group Dates Together in a Pivot Table - Learn how to group your data together by date in this short video.
- How to Use Pivot Tables in Excel to Create Sub-Reports - Another useful function of Pivot Tables that could save you time at work.
Why not sign up to our newsletter?
Sign up to our monthly newsletter, full of tips, tricks and news to help you to be happier and more productive at work.
Learn More Pivot Table Tips in Our Training Courses
Learn how to create Pivot Tables and more with our Excel training courses, to help you to make the most from your data.
With our Excel for Intermediate Users course, you will learn how to create a Pivot Table and how to filter the data to show just what you need with Slicers. We will also explore Pivot Charts, a visual representation of your Pivot Table which you can adjust in different ways to show the information you need.
Our Excel for Intermediate Users: Excel Databases course has been designed for those who use Excel to manage data such as lists of residents, birthday lists, or databases. You will learn how to create a Database in Excel and manage this with Advanced Filter options and create Pivot Tables to see the information you need.
Can't see what you need? Get in touch with us and our friendly team will help you to navigate our range of programmes, or for private group sessions, we can create a course just for you.
Why learn online with Happy?
- Interactive and engaging - just like our classroom sessions
- Bitesize or full-day sessions - fit around your schedule
- Learn from home - all you need is a quiet place to call from and an internet connection
- IT Helpline - 2 years of free support after your course
- No quibble money-back guarantee

Darren Andrews
Darren is one of Happy's Senior Trainers, able to train almost every IT course on our course programme. He worked for Happy for 12 years and has been an Associate Trainer since 2018.


